STEP 01
Calculate
Estimate RTO costs and understand delivered-order economics using your own cost and order inputs.
FOR INDIAN APPAREL ECOMMERCE FOUNDERS WHO ACCEPT COD
If You Can Export Your Orders, You Can Start Investigating — Then Decide What to Fix First.
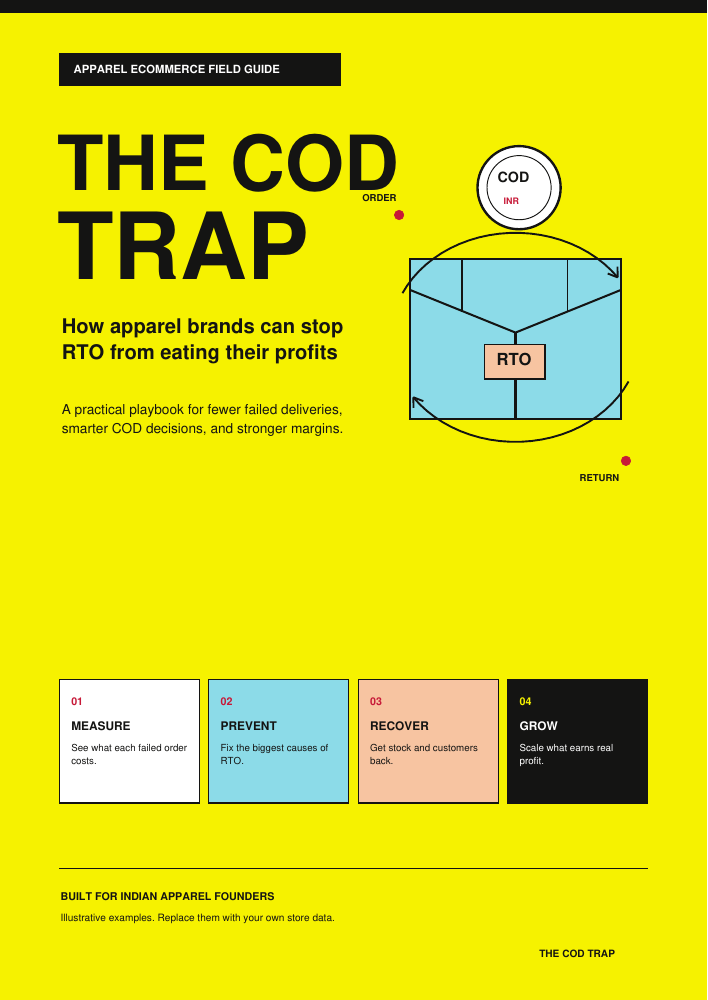
Get the COD Trap Playbook & Toolkit: a practical, spreadsheet-based system to understand failed-delivery costs, find patterns in your orders and track your next move over 90 days.
| Payment type | RTO rate | Parcels |
| COD | 33% | 264 |
| Prepaid | 2% | 4 |
*Brand X is a fictional example in the playbook. Figures are illustrative and are not benchmarks or guaranteed outcomes.
Let me ask you something.
When you open your store dashboard, what do you look at first?
Orders. Revenue. Ad spend. ROAS.
Those numbers are easy to see. But there’s another number that can quietly change the economics of an apparel brand: how many dispatched orders actually reach the customer.
Picture this. It’s the end of the month. Your store has generated a healthy number of orders. You’ve paid for the ads. Your team has packed the parcels. The courier has delivered some and returned others. Suddenly, the revenue you expected and the money your business can actually rely on are two very different things.
And now you have questions.
Is COD the problem? Is it the courier? A particular pincode? A product or size? A campaign that brings orders but weak delivery outcomes? Or are you looking at a blended RTO rate that hides the real story?
The frustrating part is that a high RTO rate tells you something is wrong. It doesn't automatically tell you what to do next.
When a parcel comes back, the cost may include forward shipping, return shipping, packing and handling, damage or loss—and the advertising cost allocated to the order. Stock can also remain unavailable while the parcel is in transit or waiting to be inspected.
That doesn’t mean every failed order costs the same amount. It means you need to calculate the cost using your own inputs, rather than treating a generic industry average as your business truth.
Brand X is fictional. The ₹475 estimate and all other figures are illustrative inputs in the playbook, not industry averages. Actual results depend on your order mix, costs, rates and accounting conventions.
Here’s where many founders get stuck.
They know RTO is expensive, so they try something. Maybe they switch couriers. Maybe they reduce COD availability. Maybe they offer a prepaid discount. Maybe they change the ads.
Sometimes a change helps. Sometimes it reduces conversions, costs more than expected, or addresses the wrong issue. And if three changes go live together, it becomes difficult to know which one made the difference.
You don’t need another list of random RTO tips.
You need a repeatable way to move from “I think this is the problem” to “Here’s what the data suggests, here’s what we’ll test, and here’s how we’ll judge it.”
That's why the toolkit is built as one connected workflow.
It starts with the money, moves into your actual orders, helps you prioritise the most important findings, and gives you a place to track what happens next. You use your data. You choose the intervention. You review the outcome after the delivery cohort is mature enough to judge.
Five steps. One practical job: give you a clearer basis for deciding what to investigate and what to do next.
Estimate RTO costs and understand delivered-order economics using your own cost and order inputs.
Look for patterns by COD/prepaid, pincode, product, size, campaign, courier and recorded reason.
Rank findings by failed-parcel volume and estimated cost—not just the highest percentage.
Choose a targeted intervention, document the hypothesis and change one major variable where practical.
Compare mature outcomes and decide whether to keep, stop or rework the change.
The toolkit helps you structure the decision. It does not automatically predict, block or prevent RTO—and it does not guarantee savings.
Price inclusive of GST. No fake “limited time” countdowns. Just the files and the workflow.
And here’s an important point: the answer is not automatically to switch COD off.
COD can be important to customer conversion. A blanket restriction might avoid some failed parcels but also lose customers who would have accepted their orders. The right decision depends on your own delivery outcomes, margins and customer behaviour.
The playbook walks through possible approaches—including prepaid incentives, order confirmation, address and phone checks, clearer fit information, targeted risk handling, courier comparisons and evaluating advertising by delivered orders. The aim is to help you decide what deserves a test, not to tell every brand to use every tactic.
This is the practical transformation the tools are designed to support—not a guaranteed change in your RTO rate.
And that's not all…
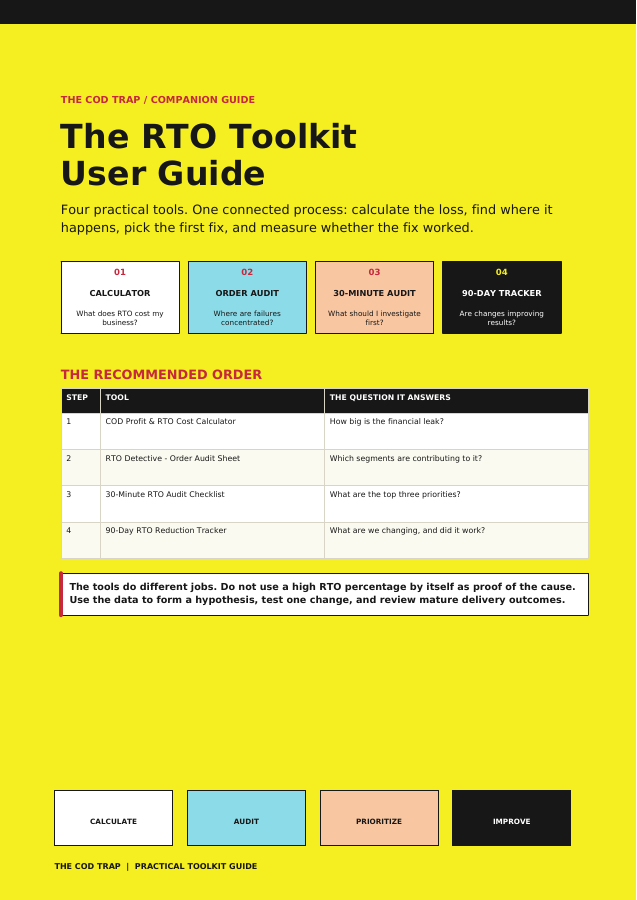
The playbook gives you the thinking. The tools help you put that thinking to work. The companion guide explains how the files fit together.
One process: calculate → investigate → prioritise → test → track.
Learn the RTO economics, why parcels fail, what to investigate and the operational levers worth testing.
Estimate the financial impact of RTO, delivered-order economics and scenario changes using your inputs.
Inspect patterns across payment type, pincode, product/size, campaign, courier and RTO reason where data is available.
Structure the review and write down the top findings, estimated cost and first test.
Record weekly scorecards, planned interventions and experiment results, then decide what to keep or change.
Follow the recommended order, understand workbook inputs and avoid common measurement and double-counting mistakes.
No monthly subscription. No courier integration or automated RTO prediction included.
The 10× value test
Use the toolkit to calculate your actual cost, find where failed orders are concentrated, and test a targeted improvement. If your own data reveals an opportunity worth at least ₹4,990 over time, that would be 10× the purchase price. Whether you find that opportunity—and whether an intervention works—depends on your business.
This is an illustrative value-test threshold to help you think about the economics, not a proven market valuation, promise of savings, or claim that every buyer will recover 10×.
That's the idea behind a value-led offer. You are not buying a folder full of files just because they are bundled together. You are getting a method for answering important questions about a recurring business cost.
A free calculator may tell you part of the answer. A courier dashboard may show delivery status. Your own spreadsheets may contain the information already. The toolkit gives you a consistent way to connect the numbers, investigate the patterns, choose the next test and review the outcome.
For some stores, that could be a useful step toward avoiding an expensive blind decision. For others, the first finding may simply be that there isn't enough clean data yet. That is still a more informed starting point than pretending a single percentage tells you everything.
Clear answers before you decide.
No. The bundle includes the 26-page playbook, two Excel workbooks for calculating and auditing, a printable checklist, a 90-day tracker and a companion user guide.
No. It helps estimate costs, investigate patterns and track interventions. Results depend on your data and implementation.
No specific integration is included. Use exports from Shopify or a compatible system if the required fields are available.
Around 60–90 days where possible, excluding recent parcels whose outcomes are unclear. Small segments require caution.
You need to enter data carefully and preserve formula cells. The companion guide explains how to start.
No. Brand X is fictional; the values are illustrative. Replace them with your own rates, fees and costs.
₹499 including GST for the digital bundle. Configure digital delivery to occur only after successful payment is verified.
Get The COD Trap Playbook & Toolkit and follow one connected process to calculate, investigate, prioritise, test and track—without blindly switching COD off for everyone.
The toolkit is a decision aid, not a guarantee of savings, a prediction system or financial advice. Brand X and its figures are fictional and illustrative. Use your own delivery outcomes, rate cards, fee basis and cost conventions. Avoid counting advertising spend twice.